The Problem Technology Federal Grants Intelligence Pilot Program Contact (214) 471-2988
Backed By
Tom Love Innovation Hub · OU
OU Startup Innovation Fund
Approved Vendor · Ion Wave (TX/OK)
Norman, Oklahoma · Est. 2026
Grade Crossing Intelligence Platform

Unlock Federal Funding.
End the Bottleneck.
Save Lives.

Trainwatch automates the precise, continuous grade crossing data your city needs to win multi-million dollar FRA grants — and give EMS unrestricted access to every neighborhood.

$2.4B
FRA Grant Program
Zero.
Railroad Permits Required
24/7
Automated Monitoring
BNSF
VIBRATION
Crossing Status
BLOCKED
Duration
00:00
EMS Impact
Critical
Data Log
Syncing
Live Product Simulation

What Your Dispatchers
See in Real Time

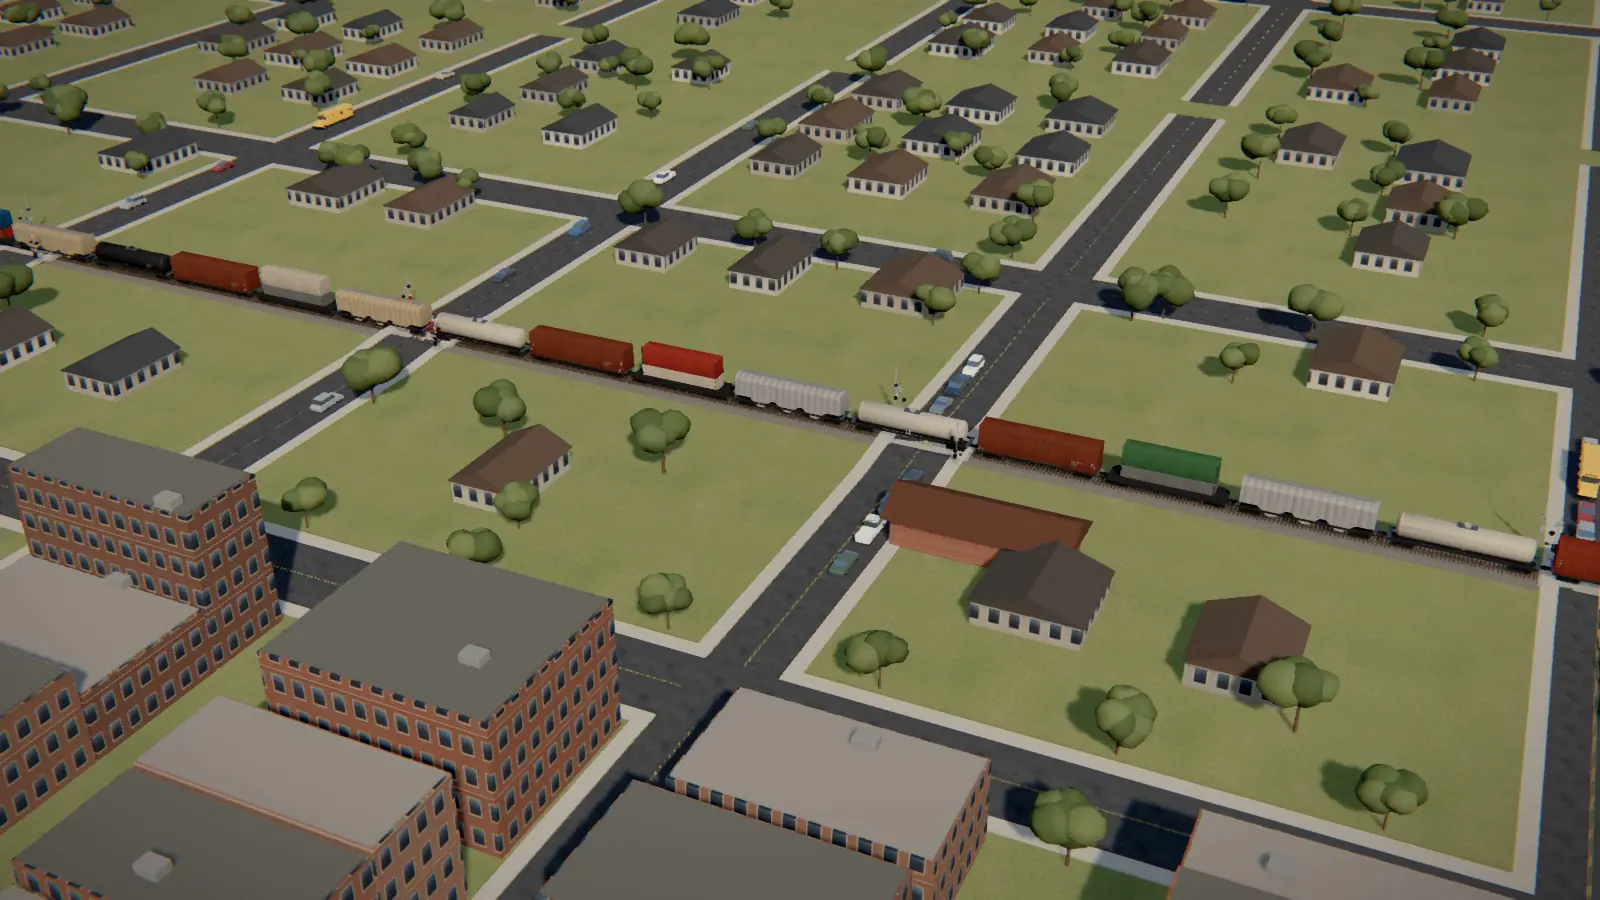
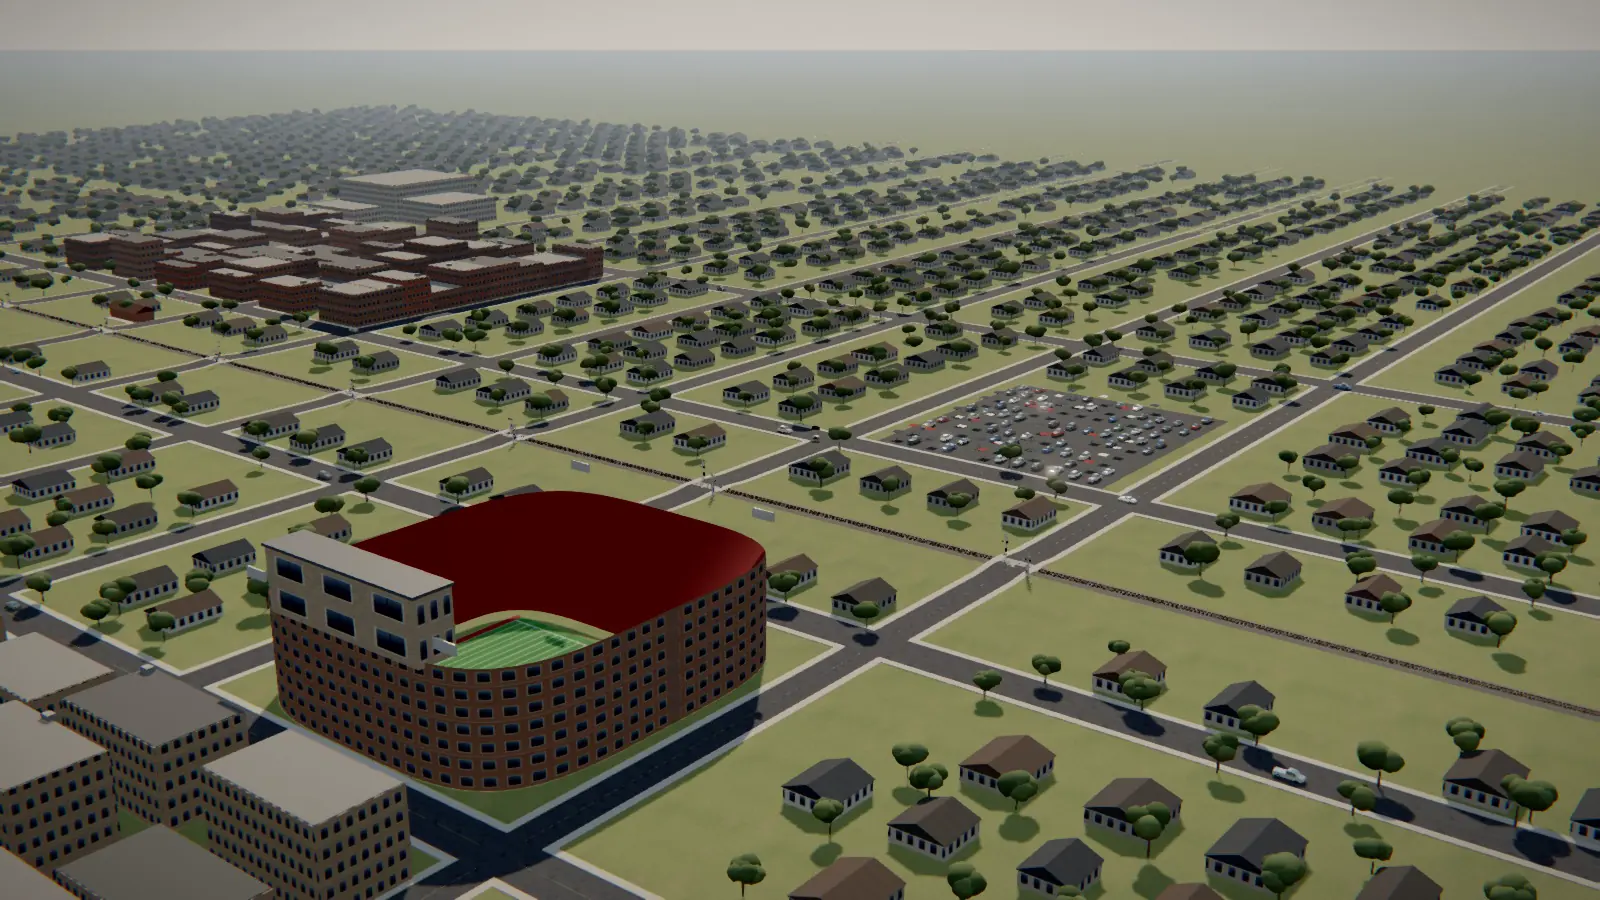
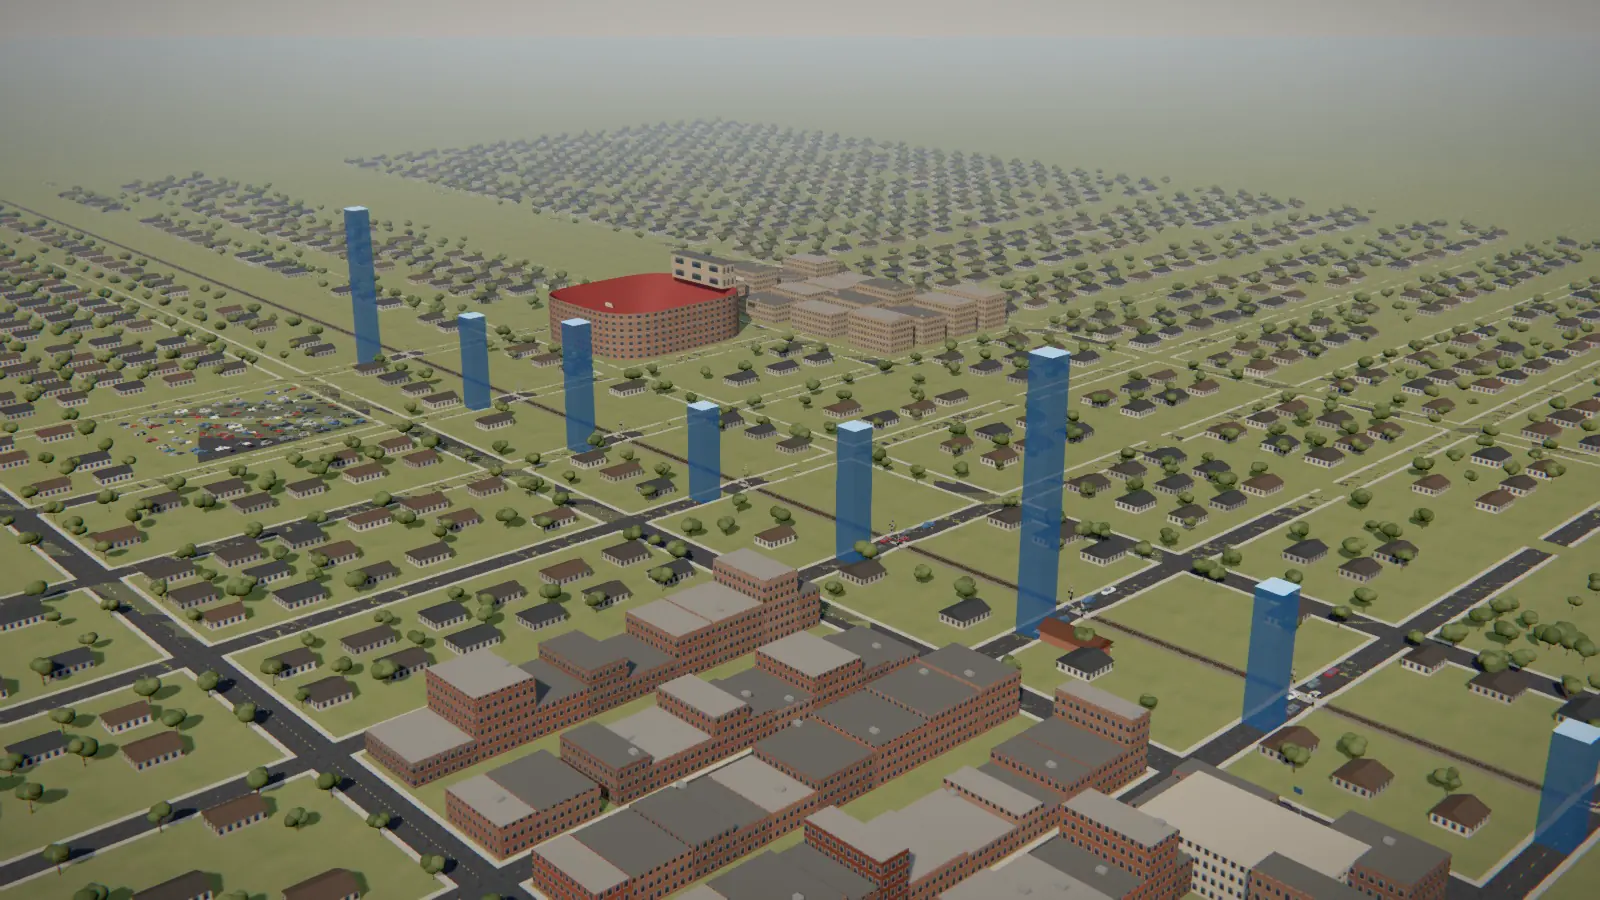
This is a simulation of the Trainwatch city dashboard. In deployment, crossing statuses update automatically from live sensor data.

Norman, OK · BNSF Corridor · 5 Monitored Crossings
W. Main Street
BNSF MP 412.3
W. Lindsey Street
BNSF MP 411.8
W. Tecumseh Road
BNSF MP 413.1
W. Constitution St
BNSF MP 410.9
Cedar Lane Road
BNSF MP 414.2
Session Stats — Today
Total Blockages0
Avg Duration
Longest Block
EMS Impacts0
Data Log Status● Syncing to FRA
Event Log
--:--Awaiting sensor data...
⚠ Simulation only — crossing names and statuses are illustrative. Live deployments connect to real sensor hardware.
The Problem

One Train.
Half Your City
Cut Off.

At-grade rail crossings don't just slow traffic — they fracture your city into zones of haves and have-nots. A prolonged blockage can mean the difference between life and death, and without hard data, your city can't prove it, can't fund a solution, and can't change it.

EMS Response Paralysis

When a train blocks a crossing for 10, 15, or 20 minutes, it doesn't delay response — it eliminates access to entire neighborhoods. Research published by the Federal Railroad Administration confirms that blocked crossings remain one of the leading preventable causes of delayed emergency response.

The Federal Funding Gap

The FRA's Railroad Crossing Elimination (RCE) Grant Program has $2.4B available for grade separations and closures. But applications require verified, longitudinal data on crossing frequency, duration, and severity — data most municipalities cannot produce, and so cannot compete.

Anecdotes Won't Win Grants

Federal reviewers demand machine-verified incident logs: exact arrival times, blockage durations, and frequency data across months of operation. The DOT's official guidance specifies data standards that manual collection cannot reliably meet.

The Technology

Smart Infrastructure.
Zero Red Tape.

Trainwatch deploys a proprietary hybrid sensor network — combining ground vibration detection with computer vision — to generate the DOT-grade, legally defensible crossing data your city needs to build its federal funding case. From day one.

No Railroad Permits. No Negotiations. No Delays.

Every Trainwatch sensor is installed entirely outside the railroad right-of-way. Your city retains full control. You never need to engage the railroad, navigate their legal teams, or wait months for access approval.

01

Hybrid Vibration + Computer Vision Sensors

Ground-coupled vibration sensors detect train presence with precision. Paired with computer vision cameras mounted on public infrastructure, the system cross-validates every event for maximum accuracy and redundancy.

02

Automated DOT Grant-Ready Reporting

Our platform automatically generates structured incident logs — timestamped arrival, departure, and total blockage time for every event — formatted to meet FRA data submission standards.

03

Continuous, Unattended Operation

Once deployed, Trainwatch monitors 24/7 with no staff overhead. The system alerts city staff to high-severity events in real time and builds a cumulative evidentiary record over weeks, months, and years.

Federal Grant Intelligence

The Data Exists
Whether You Collect It or Not.

Cities that win FRA grade crossing grants have one thing in common: verified, longitudinal incident data. Trainwatch exists to give your city that record — because when the next funding window opens, cities with data will compete. Cities without it won't.

Active FRA Funding Windows — 2026

Two programs are open right now. Both require documented crossing data to be competitive. Cities starting data collection today will be positioned for this cycle and every future round.

RCE · Crossing Safety Program
$1.15 Billion Available
Grade separations, crossing closures, safety upgrades
Deadline: June 8, 2026 · 11:59 PM ET
--d --h --m
CRISI · Infrastructure Program
$2.04 Billion Available
Last IIJA-guaranteed round — future rounds subject to annual appropriations
Deadline: June 22, 2026 · 11:59 PM ET
--d --h --m

CRISI notice: This is the final round of IIJA-guaranteed rail infrastructure funding. Future cycles depend entirely on annual Congressional appropriations — with no minimum guaranteed amount.

Request Pilot Consultation →
Pelham, Alabama · FRA RCE Grant Award
$41.7M
Railroad Crossing Elimination Grant
✓ AWARDED

A Community Divided — and the Bridge That Reconnected It

Pelham documented how at-grade crossings — specifically along Shelby County Road 52 — routinely trapped EMS units and cut off residential neighborhoods from emergency services. With verified data demonstrating severity and frequency of blockages, the city made a compelling case to federal reviewers and secured $41.7 million to construct a permanent grade separation bridge.

✓ Grant funded permanent grade separation eliminating EMS access crisis
Houston, Texas · FRA RCE Grant Award
$36.9M
Railroad Crossing Elimination Grant
✓ AWARDED

850 Blockage Incidents. One Undeniable Application.

Houston's grant application presented verified records of 850 documented train blockage incidents in a single year at a specific crossing. The result: $36.9 million awarded. Furthermore, Harris County continues to secure millions in targeted grants simply to assess ongoing crossing safety in the East End.

✓ 850 verified incidents in 12 months — the exact data Trainwatch generates
Benefit-Cost Analysis (BCA) Estimator

Calculate Your True Economic Impact

Federal reviewers require applications to calculate economic loss using specific Department of Transportation (DOT) valuation metrics. Use the sliders below to estimate the annual economic drain of your crossing based on US DOT standard Value of Travel Time Savings (VTTS).

Average Annual Daily Traffic (AADT): 15,000
Average Trains Per Day: 12
Average Blockage Duration (Minutes): 15 mins
Estimated Annual Economic Drain
$2,217,375
Calculated using standard DOT queuing logic and current blended VTTS rates ($32.40/hr).

Questions Directors
Actually Ask

What does a pilot actually cost, and what does my city get?

A standard 90-day pilot covering one crossing runs $3,500–$9,500 depending on scope, and stays well below the $25K threshold that triggers a formal RFP in most TX/OK municipalities — meaning your department can approve it directly. That includes full sensor deployment, live dashboard access for your staff, and a final FRA grant-formatted data report with video evidence package. No recurring fees during the pilot period.

How long until we have grant-ready data?

For a competitive infrastructure application, 90 days of sensor data is the target. However, for cities that want to act before the June 8, 2026 RCE deadline, Trainwatch can combine available FRA Safety Data API historical records with whatever sensor data you can collect from now until the deadline. More importantly, every day of data collected now strengthens your position for future cycles — and future funding rounds will require the same evidence. Start now and you're ready for every window that opens, whether that's this year or next.

Do we need to involve the railroad or get their permission?

No — and this is one of the most important design decisions we made. Every Trainwatch sensor is installed on public infrastructure entirely outside the railroad right-of-way. Your city retains full control of the timeline and the hardware. You never need to engage the railroad, navigate their legal teams, or wait months for access approval. This typically cuts deployment time from 6–12 months to under two weeks.

What happens to the data after the pilot ends?

The municipality retains 100% ownership of all crossing data generated during the pilot. Trainwatch provides the data processing and DOT-compliant formatting — we do not sell, license, or monetize your city's crossing records. At the end of the pilot you receive a complete data export in standard formats, regardless of whether you continue to a full deployment.

How much staff time does this require from our department?

Minimal. Installation takes under one hour with zero traffic disruption. Once deployed, the system runs unattended 24/7 — there is no monitoring requirement on your staff. We provide a single point of contact for any maintenance issues and respond to any sensor outage within 24 hours. Your department's primary involvement is reviewing the final data report at the 90-day mark.

Does this work without city Wi-Fi or a network connection?

Yes, completely. Every unit operates on its own independent cellular/LTE connection and can be equipped with solar power and internal battery reserves. No hardwiring, no pavement cuts, and no exposure to your municipal IT infrastructure. The unit functions in locations with no existing city infrastructure whatsoever.

The Pilot Program

Initiate a
Data-Gathering
Pilot Program.

We are not asking for a long-term procurement commitment. We're asking for the chance to prove what your most problematic crossing is actually costing your community — and to give you the data to do something about it, permanently.

EARLY STAGE BACKING BY: Tom Love Innovation Hub Logo
What your pilot includes

Full Sensor Deployment

Hybrid vibration + computer vision hardware installed on your target crossing, fully operational and calibrated.

Live City Dashboard

Real-time access to crossing event data, blockage durations, and cumulative incident history for your staff.

FRA Grant-Formatted Reports

Automated, submission-ready data exports aligned to FRA RCE Grant documentation requirements.

Grant Strategy Consultation

Our team works alongside your public works staff to build a competitive RCE Grant narrative around your crossing data.

Zero Railroad Permit Exposure

All hardware positioned outside ROW. Your city controls the timeline. No railroad attorneys, no right-of-way negotiations.

Useful Grant Resources
FRA RCE Grant Program ↗ FRA Blocked Crossings Portal ↗ DOT RAISE Grant Program ↗ DOT Oversight & Examination Report ↗
Deployment Timeline

The 90-Day Pilot Roadmap

A transparent, zero-friction deployment plan designed to generate FRA-ready data without burdening your municipal staff.

01
Week 1

Site Survey & Calibration

Our engineering team conducts a remote and physical survey of the problematic crossing to determine optimal sensor mounting points on existing public infrastructure.

02
Week 2

Zero-ROW Deployment

The hybrid vibration and optical sensors are installed entirely outside the railroad right-of-way. Total installation time takes less than 1 hour with zero traffic disruption.

03
Week 4

Live Dashboard Access

City engineers and EMS dispatch receive secure access to the Trainwatch portal, providing real-time crossing statuses, blockage alerts, and early cumulative data.

04
Week 12

FRA Data Delivery

At the 90-day mark, we deliver a comprehensive incident log—detailing arrival times, durations, and clearance times—ready to be attached to your DOT grant application.

Active Intelligence — Public Record

We Already Know
Your Crossing.

Trainwatch runs a daily automated scrape of the FRA Safety Data API, ArcGIS municipal records, and DOT incident narratives across TX, OK, LA, AR, KS, and MO. Every city below has been scored, ranked, and briefed using nothing but public federal data. If your city appears here, this information is already on the record — the only question is whether you're acting on it.

25+
Cities Scored
Daily
FRA Data Refresh
6
States Monitored
$0
Cost to Cities to View
Unresolved
Forney, TX Union Pacific

Broad Street & Pinson Road Crossings

City of Forney Engineering Dept. · Kaufman County
19 FRA Incidents / 12mo
12.0 Friction Score
High FRA Grant Fit
Critical — Resident Complaints + Ghost Train Events

"Ghost Train" events — gates activating with no train present — are generating a documented surge of resident complaints to City Council. The City currently has no independent dataset to hold Union Pacific accountable or to qualify for FRA Quiet Zone designation.

No verified blockage duration data on record — Quiet Zone application cannot proceed without it
False activation events unlogged — no evidence base to compel Union Pacific operational review
Alternate route (Hwy 80 Overpass) exists but residents have no real-time signal to use it
Source: FRA Blocked Crossings Portal · Field Analysis Discuss This Brief →
Priority Pilot Target
Norman, OK BNSF Railway

Main St, Lindsey St & Tecumseh Rd Crossings

City of Norman Capital Projects · Cleveland County
21+ FRA Incidents / 12mo
13.1+ Friction Score
High FRA Grant Fit
Critical — EMS Access + Active RCE Grant Eligibility

The BNSF corridor bisects Norman, cutting off the University of Oklahoma campus from emergency services and residential zones for documented periods exceeding 20 minutes. Oklahoma's blocked crossing statute was struck down as unconstitutional in 2022 — federal data is the city's only remaining enforcement tool. Norman is Trainwatch's priority pilot target: FRA historical records can be compiled immediately, with live sensor data collected from deployment through the June 8 RCE deadline.

FRA RCE grant applications require verified, empirical blockage data — Norman is currently submitting estimates
Justice40 eligibility unverified — no documented data on disproportionate neighborhood impact to hospital access
5 BNSF crossings identified as pilot-eligible under 49 CFR Part 222 reporting standards
Source: FRA Safety Data API · ArcGIS Municipal Records Start Norman Pilot → June 8 Window
Unresolved
Carrollton, TX BNSF Railway

Plano Parkway Crossing — Hebron High School Zone

City of Carrollton Engineering Dept. · Dallas County
18 FRA Incidents / 12mo
11.7 Friction Score
High FRA Grant Fit
High — School Zone Safety + CIP Funding Eligibility

Rail traffic on Plano Parkway during the 3:30–4:15 PM school dismissal window creates a documented cascade effect, trapping buses and student drivers. Without verified blockage timing data, the City cannot build a competitive CIP or federal grant case for grade separation at this corridor.

Peak blockage window coincides exactly with school dismissal — SROs unable to respond to campus emergencies during this period
No machine-verified incident log exists — federal reviewers cannot score what isn't documented
School District Duty of Care liability exposure increases with each undocumented entrapment event
Source: FRA Safety Data API · LISD Transit Records Discuss This Brief →
Unresolved
Wynnewood, OK BNSF Railway

Primary Refinery Access Crossing — CVR Energy Corridor

CVR Energy / Wynnewood Refinery · Garvin County
15 FRA Incidents / 12mo
10.0 Friction Score
OSHA PSM Primary Risk
OSHA PSM Exposure — Critical Point of Failure

Emergency response protocols for the Wynnewood refinery depend on unobstructed access via the primary municipal crossing. BNSF operations create frequent, unmonitored blockages that delay mutual aid fire response by an estimated 12–15 minutes — a documented "Critical Point of Failure" under OSHA Process Safety Management standards.

OSHA 29 CFR 1910.119 (PSM): Known, unmonitored access blockage risk may constitute a citable safety violation
12–15 minute fire response delay in a containment loss scenario — no automated rerouting protocol currently active
Insurance risk rating exposure: failure to mitigate known access risks affects premium structure and post-incident liability
Source: OSHA PSM Records · BNSF Operations Data · Field Analysis Discuss This Brief →
Live Lead Scout — FRA Friction Index
Top-Ranked Corridors by Risk Score
Friction Score = (Incidents × 0.4) + (Hospital Proximity × 0.2) + (School Proximity × 0.15) + (Industrial Volume × 0.25). Refreshed daily via FRA Safety Data API.
Rank City State FRA Incidents Friction Score Pitch Angle Grant Fit Status
01 Kansas City MO 28 16.5 Hazmat / Supply Chain High Prospect
02 Baton Rouge LA 24 14.9 Hazmat / Supply Chain High Prospect
03 Longview TX 22 13.4 Hazmat / Supply Chain High Prospect
04 Wichita KS 21 13.1 Hazmat / Supply Chain High Prospect
05 Shreveport LA 20 12.6 Hazmat / Supply Chain High Prospect
06 Mesquite TX 19 12.0 Safety / Public Welfare High Prospect
07 Plano TX 18 11.7 Safety / Public Welfare High Prospect
08 Waco TX 18 11.7 Hazmat / Supply Chain High Prospect
09 Garland TX 17 11.5 Hazmat / Supply Chain High Prospect
10 Little Rock AR 17 11.2 Safety / Public Welfare High Prospect
Source: FRA Safety Data API (safetydata.fra.dot.gov) · ArcGIS Municipal Records · DOT Incident Narratives · Updated Daily 4:00 AM CT

The Data Is Your Insurance Policy.

Grant cycles open and close. Cities with verified, longitudinal crossing data compete in every one. Cities without it can't compete in any. Your crossing's history exists whether or not it's documented — start building the record now.

Start Norman Pilot → June 8 Window Get Grant Readiness Checklist

Oklahoma's blocked crossing statute was ruled unconstitutional in 2022. Federal documentation is your only enforcement tool. Don't wait on Washington.

Start Today

Ready to Start
Your Pilot?

No long-term commitment. No railroad permits. Just a conversation about your city's most problematic crossing and how we can help you document it for federal funding.

Request a Pilot Consultation

Takes 2 minutes. We'll reach out within one business day to discuss your city's crossing situation.

Request Received.

Our team will reach out within one business day. For immediate needs, call (214) 471-2988.